August 8, 2026
KRE Near All-Time Highs. The AI Supply Chain Is Why.
The hyperscaler capex wave is now showing up on regional bank balance sheets. The Q2 earnings data makes the case.
First a note from Behind the Markets
Hey Friend,
A Chicago wealth manager runs $31.7 billion across 471 holdings.
Top positions? Apple. Microsoft. Nvidia. The usual.
Then there’s one position that breaks the entire pattern.
$705 million in a single small-cap industrial company.
19% of the entire company. So large the SEC requires them to publicly disclose every move.
Their most recent filing? They didn’t trim.
They added another 42.2% – in one quarter.
When a fund that never makes concentrated bets makes its most aggressive one – in a company tied to Elon Musk’s physical power crisis – it’s worth knowing why.
Dylan Jovine knows exactly why.
See the stock behind the $705 million bet >>
“The Buck Stops Here,”
Kelly Maguire
Behind the Markets
KRE Near All-Time Highs. The AI Supply Chain Is Why.
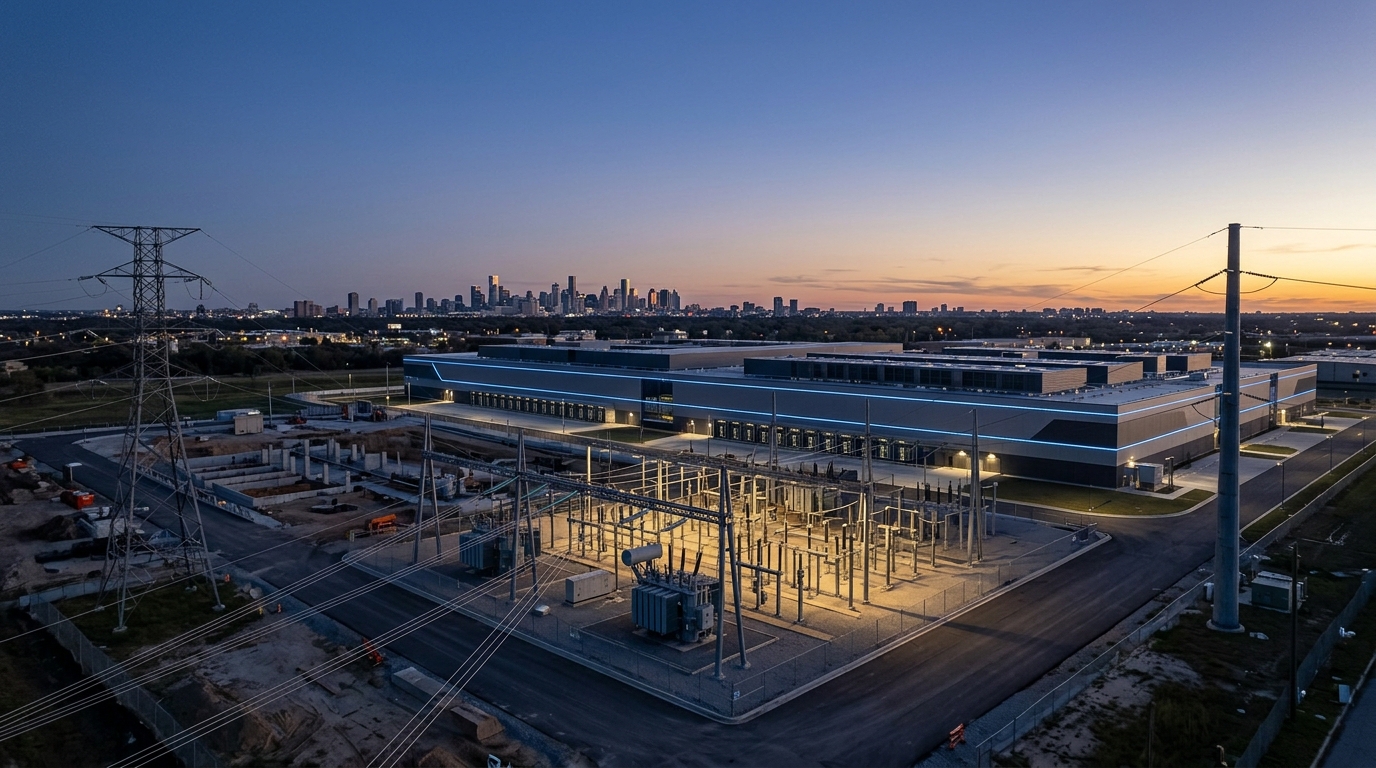
Two years of AI coverage has produced a predictable roster of winners: the chip designers, the hyperscalers, the power utilities, the cooling equipment makers. What has gone mostly unexamined is the second-order story. The manufacturers, equipment suppliers, HVAC contractors, and concrete firms who borrow from regional banks to fulfill the orders that the AI capex cycle generates are now drawing on credit lines at the fastest pace in years. Regional banks are collecting the interest income.
This is not a story about regional banks becoming AI lenders. Most of them have deliberately stayed out of data center construction financing. It is about a multi-trillion-dollar infrastructure buildout finding its way onto the balance sheets of manufacturers and contractors from Pittsburgh to Birmingham to Dallas, all of whom borrow from regionals to bridge the gap between order and delivery. The macro signal is clean, the Q2 earnings data confirms it, and the sector has already moved — which means the question now is whether the cycle has legs into year-end or whether rate and credit risks close the window.
Where KRE Stands
KRE traded to a 52-week high of $78.35 and was changing hands near $76 as of August 7, with a year-to-date return of roughly 19%. The 52-week low was $57.55. That move — more than 32% off the lows — is not noise. It reflects a genuine commercial lending reacceleration that the Q2 earnings season just confirmed across every major regional bank that reported.
The CNBC data shows KRE hit a fresh 52-week high on August 4. The ETF tracks the S&P Regional Banks Select Industry Index on an equal-weighted basis, giving each holding roughly a 2% to 3% slot regardless of market cap. That structure means the performance is not being driven by one or two large-cap names. It is broad-based sector strength, which is precisely what the underlying loan data reflects.
The Fed’s Loan Officer Survey Delivered a Clear Signal
The Federal Reserve released its July 2026 Senior Loan Officer Opinion Survey last week, covering Q2 lending conditions across 56 domestic banks. The headline finding for commercial credit was unambiguous: banks reported stronger demand for C&I loans from large and middle-market firms, while standards held essentially unchanged. That combination — firming demand with stable credit standards — is the kind of backdrop that supports net interest income growth without triggering a concurrent deterioration in credit quality.
Commercial real estate lending showed easier standards as well, though demand was basically unchanged on that side of the book. The contrast matters. The CRE pocket is stabilizing while C&I is accelerating. Banks with C&I-heavy loan books are the direct beneficiaries of that bifurcation, and that is exactly the profile of the regionals that drove KRE’s year-to-date gain.
What Q2 Earnings Actually Showed
Strip out acquisition noise and the picture at the major regionals is consistent. Net interest income expanded, margins held or widened, and commercial loan growth accelerated in nearly every case. Three banks make the case most clearly: PNC, Fifth Third, and Regions.
PNC delivered the quarter’s most instructive data point. Net income came in at $2.1 billion, or $4.81 diluted EPS, with adjusted EPS of $4.85 versus $3.85 a year earlier. Net interest income reached $4.107 billion, up 4% sequentially and 16% year over year, with NIM expanding 16 basis points year over year to 2.96%. Average loans totaled $363.2 billion, up 13% from a year earlier. Total revenue was $6.9 billion, a record quarter. PNC also raised its quarterly dividend 18% to $2.00 per share, a signal that management is confident in the earnings trajectory.
PNC CEO Bill Demchak’s characterization of the loan growth was notable for what it did not say as much as what it did. When an analyst asked directly whether PNC was picking up data center-related lending or could connect loan demand to second-derivative AI capex, Demchak replied: “It’s too broad-based to lay it all on AI. At the margin it’s impacting what we’re doing.” He added that the growth was “coming from kind of all sectors.” That breadth is the structurally important detail. A commercial lending cycle that depends on one catalyst is fragile. One that has spread across industries and geographies is durable.
Regions confirmed the same dynamic from a different angle. Net interest income rose 2% sequentially to $1.291 billion, driven by loan growth, fixed-rate asset turnover, and disciplined deposit cost management. Net interest margin held at 3.66% with interest-bearing deposit costs declining 3 basis points to 1.69%. Average loans rose 2.4% quarter over quarter to $98.7 billion, driven mainly by commercial lending. Regions guided for NIM to exit 2026 at approximately 3.7% — a modest but meaningful step-up that implies the margin story is not over.
The Fifth Third Lens: Lending to the Supply Chain, Not the Source
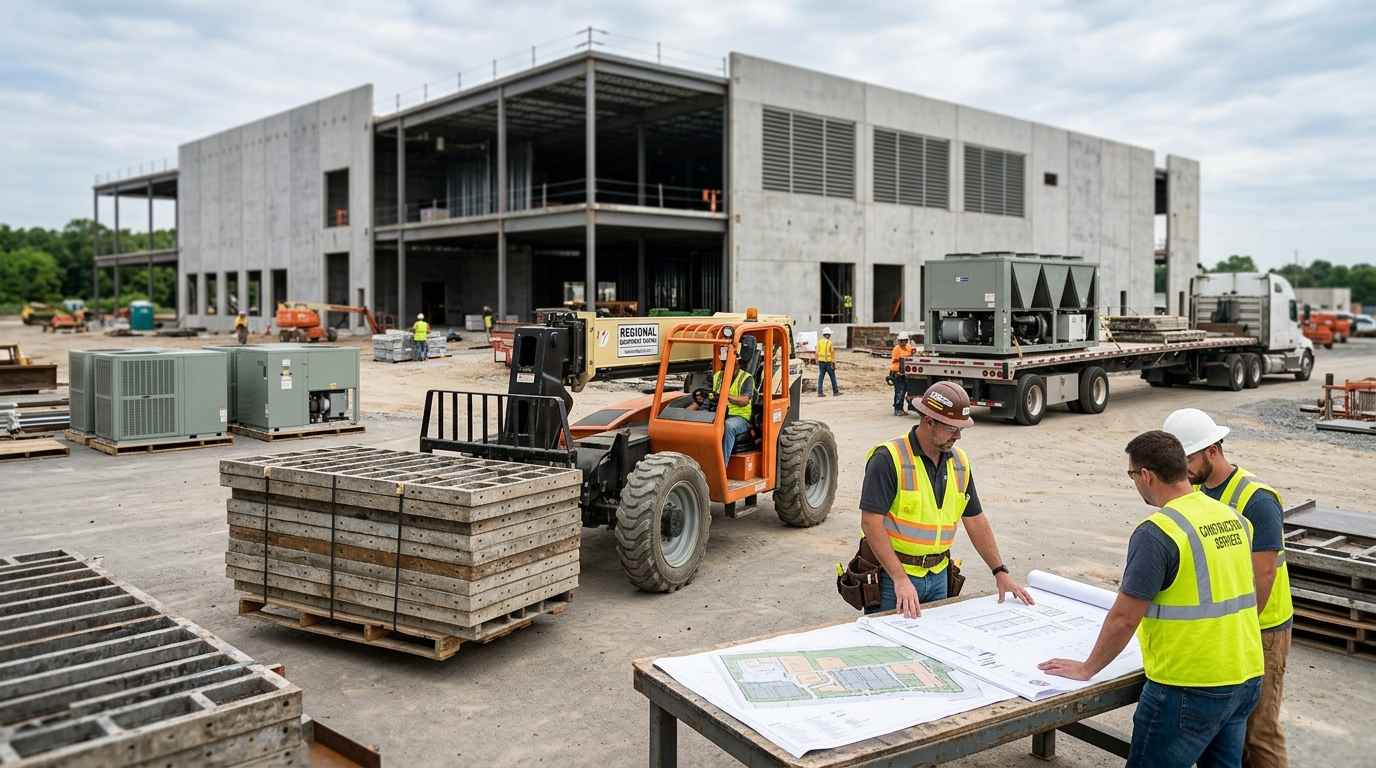
The most instructive example of how this trade actually works is Fifth Third Bancorp. CEO Tim Spence said his bank has largely avoided financing data center construction, lending instead to firms that sell concrete, aluminum, HVAC, and other construction services, as well as manufacturers of heavy machinery including cranes, tractors, and backhoes. Those businesses are benefiting from rising investment in AI infrastructure, defense spending, and broader infrastructure programs simultaneously. Spence’s formulation was direct: “You have all three of those things impacting people who make stuff… and that is our market.”
That credit posture is deliberate and defensible. When asked about data center construction financing, Spence stated that “the one guaranteed rule is that we will misestimate the amount of capacity that’s required here, which by definition means there will be some overbuilding.” Fifth Third views direct construction exposure as carrying embedded overbuilding risk that is difficult to price today. Lending to the supply chain captures the revenue from the cycle while removing binary exposure to whether any specific data center project achieves full utilization.
Fifth Third’s Q2 numbers reflected the first full quarter with Comerica on the books, which makes year-over-year comparisons noisy but the underlying trends visible. Net interest income climbed 48% year over year to $2.22 billion. NIM expanded 6 basis points sequentially to 3.36%. Adjusted EPS hit $1.02, a 4% beat versus consensus. The net charge-off ratio fell to 0.30%, the lowest since Q2 2023. Fifth Third also crossed $300 billion in total assets for the first time, crossing into Category III institution status under U.S. banking regulations.
The near-term execution risk sits in one specific date: the Comerica systems conversion is scheduled for Labor Day weekend, the final step to unlock the $850 million in annualized run-rate synergies Spence committed to deliver in Q4. A clean conversion removes the integration discount from FITB shares and lets the combined franchise’s earnings power fully show through. A disruption that affects commercial client relationships would be the idiosyncratic risk that the headline numbers currently obscure.
It Happens Before the Trade Begins
Your first options loss may have nothing to do with the market. One common order type can cost beginners before a position even gets underway. Learn the simple rule Bill Poulos says every new trader should know in this free playbook.
The Macro Connector
The transmission mechanism runs as follows. Hyperscalers and cloud providers are committing hundreds of billions to AI infrastructure annually. That capital flows to general contractors, who hire subcontractors, who buy equipment, who borrow from regional banks to finance the working capital gap between order placement and delivery. Regional banks are not investing in AI. They are lending to the companies building the physical infrastructure that houses it.
This is less a broad industrial renaissance than a redistribution of manufacturing demand toward industries positioned closest to the capex boom. Power transformers, switchgear, structural steel, HVAC systems, cranes. The companies supplying those products are running credit lines hard. Regional banks with C&I-heavy loan books and manufacturing-adjacent industry exposure are the financial intermediaries for that activity.
The risk Wells Fargo flagged is worth noting alongside the opportunity: higher-for-longer interest rates could limit borrower demand, and AI spending could crowd out other forms of capital investment in the broader economy. Those are real constraints. But the Q2 loan data, reinforced by the Fed’s July SLOOS, suggests neither has materially slowed the cycle yet.
Sector Implications: Where the Credit Cycle Spreads
The commercial lending rebound is not uniform. Office CRE remains a drag at banks with heavy legacy exposure, and the gap between industrial and office lending quality is widening. PNC’s nonperforming loans actually declined quarter over quarter, driven by lower commercial real estate nonperforming loans. That improvement is meaningful but does not fully represent the sector. Banks carrying concentrated office books face credit quality risk that headline NII growth can mask temporarily.
The deposit cost picture adds complexity. Fifth Third CFO Bryan Preston stated that “it certainly is getting more expensive to grow deposits,” with the consumer deposit franchise remaining highly competitive across Midwest, Southeast, and Southwest markets. Regions’ interest-bearing deposit costs declined 3 basis points to 1.69% in Q2, a constructive trend, but management guided for largely stable deposit costs in the second half assuming no Fed rate change. Any move toward higher rates flips that dynamic quickly. The banks translating loan volume into sustainable margin are those that kept deposit cost growth contained while commercial books expanded.
Options Market Assessment
KRE’s options market reflects a sector in post-earnings consolidation rather than at a breakout. Implied volatility is running at compressed levels relative to the ETF’s 52-week range, consistent with the calm that typically follows a broadly positive reporting season. When an ETF is near record highs with IV compressed, options are pricing calm continuation rather than either extension or reversal. For traders, that environment favors defined-risk approaches that do not overpay for directional premium.
Put/call flow in KRE has leaned toward calls over the past month, consistent with the year-to-date move and institutional interest at current levels. Put interest at strikes roughly 8% to 10% below spot has also been building, reflecting hedges against the two risks that remain live heading into August: the August 12 CPI reading and its implications for September Fed policy, and the broader credit cycle risk if the AI spending cycle slows faster than the current commercial loan pipelines suggest.
Structured Trade Framework
Bull Case. For traders expecting the AI infrastructure cycle to sustain commercial loan demand through year-end, and who believe the September FOMC meeting does not deliver a hike, a defined-risk long in KRE using a call spread targeting the prior highs captures the directional move without excessive premium outlay in the current low-IV environment. A September or October expiry gives time for the August CPI and employment data to resolve the rate debate. The Q2 earnings trend supports the fundamental basis.
Bear Case. For traders expecting a September hike, a defined-risk put spread in KRE concentrating on strikes in the 8% to 10% below-spot range targets the margin compression scenario. The primary trigger is the August 12 CPI reading. A hot number would lift hike odds quickly and remove a key macro tailwind. Legacy office CRE exposure can add an additional credit-quality catalyst at banks where that book has not yet fully resolved.
Neutral Case. Given compressed IV, a short iron condor in KRE with wings placed at roughly 6% to 7% on each side captures time decay if the sector consolidates near current levels while rate uncertainty resolves. The risk is the asymmetric gap that comes with a surprise inflation reading or a sudden deterioration in a large bank’s credit portfolio. Defined notional sizing is essential to this structure.
Risk Dashboard
The primary risk to the regional bank commercial lending thesis is not credit quality. Charge-off data and allowance trends across the sector are constructive. PNC’s net charge-offs were $226 million, or 0.25% of average loans. Regions’ net charge-offs fell 12 basis points to 42 basis points. Fifth Third’s charge-off ratio hit 0.30%, the lowest in three years. The primary risk is the rate path. If September becomes a live hike meeting, deposit betas for regional banks can accelerate faster than loan yields adjust, compressing the margin expansion that is the arithmetic core of the current earnings cycle.
The second risk is overbuilding. If AI capex commitments from hyperscalers are revised downward in the back half of 2026, the orders flowing to manufacturers who borrow from regional banks will slow, and line utilization will fall. That is a lagged effect, likely 12 to 18 months from any meaningful hyperscaler pullback. It is not a Q3 story. But it is the mechanism by which this cycle eventually turns.
The third risk is integration execution. Fifth Third’s Comerica branch and systems conversion is scheduled for Labor Day weekend — a high-stakes migration window. Fifth Third has retained 99.4% of Comerica’s commercial clients through the process so far, an impressive retention figure. But the branch conversion is the final and most operationally demanding phase. Any disruption that moves commercial client relationships would represent an idiosyncratic drag on the broader FITB thesis independent of the macro backdrop.
Forward Outlook
The structural case for regional bank C&I lending growth is tied to a capital cycle, not a credit cycle. AI infrastructure is a multi-year buildout, not a single-year event, and the supply chain exposure that regional banks carry does not require any single data center to succeed. It requires the buildout to continue. The Q2 SLOOS confirmed that C&I demand from large and middle-market firms strengthened in Q2. A second consecutive positive reading in the Q3 survey would confirm the cycle is durable rather than episodic.
PNC guided for full-year 2026 loan growth of approximately 12.5% and NII up 15% to 15.5%. Regions guided for full-year NII growth of 2.5% to 4% and expects to exit 2026 with NIM near 3.7%. Fifth Third raised full-year guidance across NII, fee income, and expenses after Q2. Those forward numbers are consistent with a sector that has more earnings runway, not one that has already priced in everything. Whether that runway extends into Q3 depends most directly on what the August 12 CPI print says about September rate policy.
The easy money in KRE has been made. The ETF is up 32% from its 52-week low and near all-time highs. What remains is a selective evaluation of which banks carry the cleanest margin trajectory, the most AI-supply-chain-aligned C&I books, and the least legacy office CRE exposure — and whether the rate environment cooperates long enough for those advantages to compound through the back half of the year.
Action Checklist
- Watch the August 12, 2026 CPI reading as the primary binary catalyst for September rate expectations. A reading above consensus will reprice hike probability quickly and directly pressure regional bank NIM assumptions.
- Track Fifth Third’s Labor Day weekend Comerica systems conversion. A clean migration removes the integration discount from FITB shares. A disruption affecting commercial client relationships would be an idiosyncratic negative independent of sector-level trends.
- Differentiate between banks with C&I-heavy loan books aligned to manufacturing and AI supply chain borrowers versus those with elevated concentrations in legacy office CRE, where asset-quality trends are moving in the opposite direction.
- For defined-risk long exposure, consider a KRE call spread in the September to October expiry range while IV remains compressed, targeting the prior highs as a near-term resistance level and exit reference point.
- Monitor the Federal Reserve’s Q3 Senior Loan Officer Survey. A second consecutive quarter of stronger C&I demand from large and middle-market firms would confirm this commercial lending cycle is durable, not a single-quarter rebound.
- Size any new position with the understanding that KRE is within 3% of all-time highs and a more hawkish Fed path can revalue the entire margin thesis rapidly around the September FOMC decision.