
The S&P 500 closed at 7,757.64 on August 7, 2026, at a record high, after a sharp reversal off the July 29 low. The rally’s engine is not mysterious. Analysts are now predicting full-year 2026 earnings growth of 30% for the index. That number would have sounded reckless eighteen months ago. Today it has a mechanism: AI agents are compressing cost structures at a pace that is finally appearing in quarterly results, not just executive commentary.
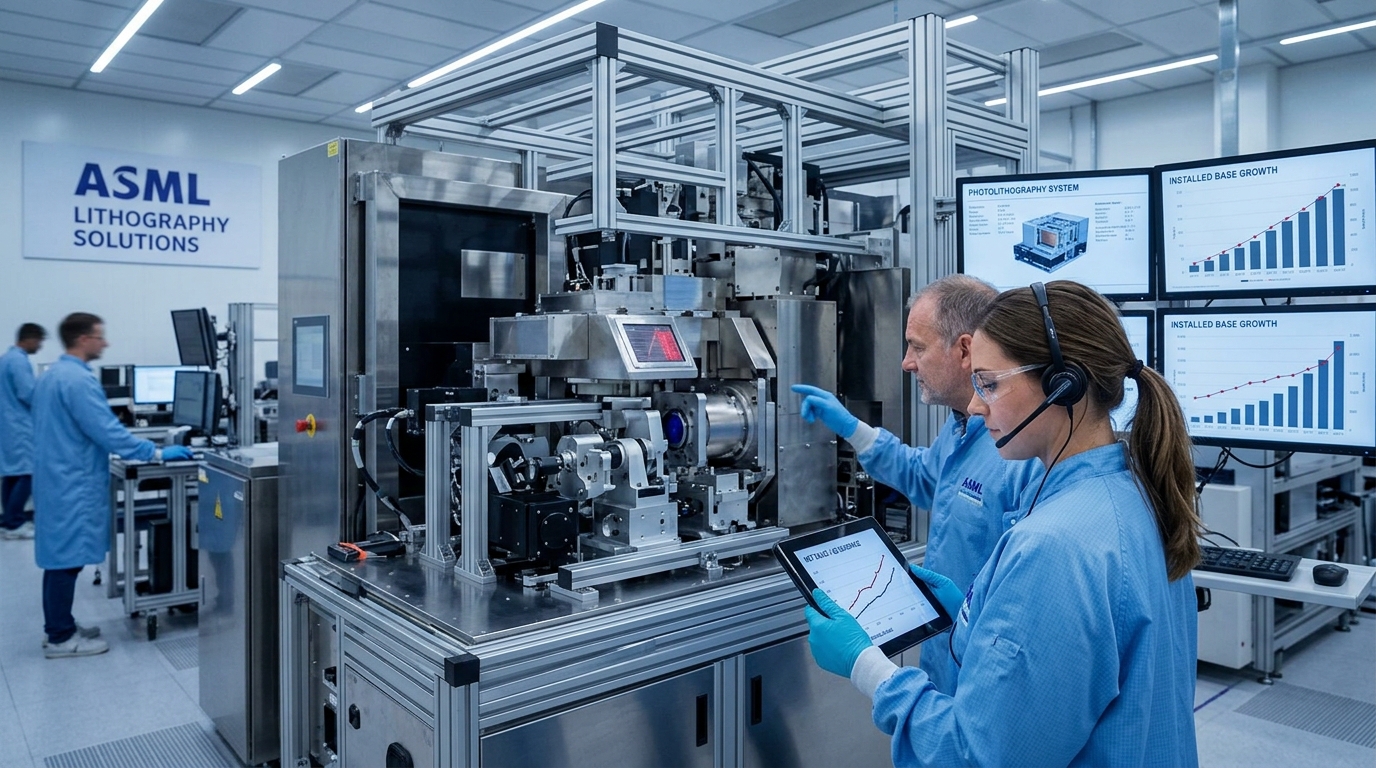
The angle worth examining right now is not the capex story. That debate has run its course. The real trade is the productivity dividend, the part where trillions of dollars in infrastructure spending converts into operating leverage across sectors that have nothing to do with semiconductors or cloud hyperscalers. That conversion is happening now, it is showing up in Q2 margins, and the market has only partially priced it.
Market Context Analysis
The S&P 500 has been hovering near record highs, and the August 7 session closed at 7,757.64 after weaker-than-expected labor market data pushed yields lower and reduced expectations of a near-term Federal Reserve hike. That same session saw the Nasdaq gain 1.3% and the Dow add roughly 152 points.
The interest rate picture is the other critical variable. The 10-year yield has been trading in a range of approximately 4.50% to 4.75%, a level elevated enough to constrain duration but not high enough to arrest the earnings expansion cycle. The Fed’s posture remains the swing factor for the second half, and the jobs data released Friday bought bulls at least one more month of runway before September becomes a live meeting.
With roughly one-quarter of S&P 500 companies having reported Q2 results as of July 24, 86% have reported actual EPS above estimates, above both the five-year average of 78% and the ten-year average of 76%.
The context for why this matters: Goldman Sachs Research has raised its S&P 500 year-end target to 8,000, projecting earnings per share of $340 in 2026, a 24% increase year over year, with AI infrastructure investment expected to account for about half of the earnings growth. Goldman is not alone. Morgan Stanley and Deutsche Bank have also floated targets in the same general neighborhood, a notable convergence among institutions that rarely agree on anything.
Sector Breakdown
The most important data point from Q2 is not what technology did. It is what everyone else did. Ten of eleven S&P 500 sectors are reporting year-over-year earnings growth, with eight of those reporting double-digit growth, led by Energy, Communication Services, Consumer Discretionary, Information Technology, and Materials. That kind of breadth does not happen in a capex bubble. It happens when productivity gains begin flowing through to income statements.
The improvements are appearing beyond technology, in sectors like waste management, HVAC production, and insurance brokerage. 22V Research says applying those gains across the S&P 500 would imply the index is worth at least 10% more. Specific examples anchor the thesis. Logistics firm C.H. Robinson Worldwide credits AI for roughly 40% productivity improvement since 2022. Fortinet posted an operating margin increase of 490 basis points for Q2. Waste Management’s Smart Truck system is delivering over $300 million in yearly EBITDA through enhanced customer service, better route optimization, and reduced operating expenses.
Financials and software are the two sectors where agent deployment is most advanced and ROI is most measurable. Banking and insurance lead sectoral deployment at 47%, while healthcare and government trail at 18% and 14%. That leadership is translating directly into margin performance. Finance and operations teams report that AI agents accelerate close processes by 30 to 50%. For a financial services company running on tight operating leverage, that compression is the difference between a margin that beats and one that disappoints.
Capital rotation within the index reflects this dynamic. Information technology led Q1 with 34.2% earnings growth. Companies supplying AI infrastructure continue to benefit from surging data center investment, while cloud providers and software companies are finding new ways to monetize AI services, with Nvidia, Broadcom, and Micron among the largest beneficiaries, alongside Microsoft and Alphabet converting AI demand into higher-margin cloud revenue. But the rotation now underway is toward second-derivative beneficiaries: industrial companies automating workflows, healthcare firms using agents in revenue cycle management, and consumer discretionary businesses deploying agents in customer acquisition. The early adopters among those non-tech names are repriced faster than the broader story suggests.
Stock-Specific Financial Breakdown
Three companies illustrate the agent monetization arc at different stages of maturity.
ServiceNow (NOW) just delivered the clearest proof of concept in enterprise software. ServiceNow’s AI business crossed $1 billion in annual contract value as the company delivered a double beat and lifted full-year subscription revenue guidance to $15.76 to $15.78 billion, with agentic deployments surging ninefold in nine months. Subscription revenue for Q2 was $3.877 billion, up 24.5% year over year, with non-GAAP operating margin of 29.5%. The milestone is more significant than the headline suggests. ServiceNow added that first-time agentic AI buyers were up more than 45% year over year. That is net new demand, not upsells into an existing base.
Salesforce (CRM) is running a parallel track. Salesforce’s Agentforce has been disclosed at $1.2 billion in annual recurring revenue, and the company landed a $1.6 billion contract with the U.S. Department of Veterans Affairs to deploy agentic capabilities across its services. Salesforce posted Q4 revenue of $10.04 billion, a 7.6% year-over-year increase, while non-GAAP diluted EPS reached $3.81. The larger signal: last year, success meant proving AI could reduce cost and improve efficiency. This year, success increasingly means proving AI can help grow the business. That shift from cost center to revenue engine is what changes the valuation conversation.
Microsoft (MSFT) remains the infrastructure layer beneath both. Microsoft has continued to expand its agent stack across Azure and Microsoft 365, with nearly 90% of the Fortune 500 now having active agents built with its low-code and no-code tools. The company has also positioned Agent 365 as its control and governance layer, and has said tens of thousands of companies are managing tens of millions of agents in Agent 365.
The margin story at the index level is also worth anchoring. The S&P 500’s blended net profit margin is tracking 15.7% in Q2 2026, and if that holds it would mark the highest net profit margin FactSet has recorded since it began tracking this metric in 2009. The estimated profit margin for 2026 recently stood at about 13.9% in aggregate, a figure that the Q2 actuals are now running well ahead of. Although 21% of S&P 500 companies now cite AI benefits, adopters delivering measurable results are seeing cash flow margin expansion at roughly 2x the global average. The gap between those two populations is the positioning opportunity.
Technical / Trading Framework
The S&P 500’s technical posture entering mid-August is constructive but requires precision. The index needed to close decisively above the 7,620 resistance level, which represented its prior record zone, for a couple of consecutive sessions before technicians could trust the change in trend. With the index back above that area, the prior resistance at 7,620 becomes the first line of support on any retest.
Volume patterns during the July 29 to early August recovery were encouraging. Since the low point on July 29, the Nasdaq has surged almost 9% in a stunning reversal, with broadening participation across market cap. There has been broad-based strength in small-, mid-, and large-cap stocks, which distinguishes this move from narrow mega-cap recoveries that tend to fade.
Key levels to monitor: 7,620 is first support. A close below 7,550 would suggest the breakout is failing and shift the weight of evidence back toward the bears. On the upside, 7,800 represents the Goldman year-end target proximity and is the level where short-term resistance is likely to cluster. The 50-day moving average, which the index reclaimed decisively this month, should now act as a backstop on moderate pullbacks.
Momentum indicators are not overbought at current levels. The VIX has been subdued, and options positioning in large AI-exposed names suggests institutions are adding exposure on dips rather than hedging against downside, which is a constructive institutional flow signal.
August through October is historically one of the market’s weaker stretches, according to Bank of America, so discipline around support levels matters more now than it did in the spring. Looking at the last three decades, the index has declined by an average of about 0.5% in August and done worse in September, with an average drop of about 0.7%. The seasonal pattern is real. It does not override a strong fundamental backdrop, but it is a reason to size positions thoughtfully rather than chase moves on strength.
Scenario Modeling
Bull Case
Goldman’s 8,000 year-end target gets hit by September if Q3 earnings guidance from major technology and industrial companies confirms that AI-agent deployments are translating into recurring revenue. The specific trigger is enterprise software ARR revisions: if ServiceNow raises its full-year AI ACV target beyond $1.5 billion, or if Microsoft’s Copilot seat count updates show accelerating enterprise penetration, the multiple on the index can hold at 21x forward earnings while EPS estimates move higher. Analysts are already calling for Q3 and Q4 2026 earnings growth rates of 27.4% and 25.2%, respectively, which means the bar for positive surprise remains achievable. In this scenario, the index tests 8,000 to 8,100 before year-end, consistent with Citi’s bull-case target of 8,300.
Base Case
The S&P 500 grinds toward 7,900 to 8,000 by December, with volatility in August and September providing better entry points for positioned traders. While enterprise adoption appears to be in its early stages, Goldman strategists expect AI’s impact on productivity and earnings to become increasingly visible in coming years, with the team embedding a 0.4 percentage point boost to S&P 500 EPS growth from AI productivity this year and a 1.5 percentage point boost in 2027. The base case assumes that the incremental productivity gains broaden modestly but that the Fed holds through September, keeping the 10-year yield near 4.50% to 4.75% and capping the multiple at roughly 21x. Earnings growth of 24% to 27% for the full year supports the index at current levels with modest upside.
Bear Case
A Fed hike in September, combined with a deceleration in AI capex guidance from one or more hyperscalers, compresses the forward multiple from 20x toward 18x to 19x. Gartner has forecast that over 40% of agentic AI projects will be canceled by the end of 2027, driven by escalating costs, unclear business value, or inadequate risk controls. If that cancellation wave accelerates, it would undercut ARR expectations at enterprise software companies and force a rerating of the AI productivity premium. A 10% to 12% correction from current levels, bringing the index back toward the 6,900 to 7,000 range, is the coherent bear case. The conditions required: a negative CPI surprise that forces the Fed’s hand, or a major enterprise software company reporting a significant miss on AI-related bookings. Neither is the base case, but both are plausible enough to warrant defined risk parameters.
Active Trader Strategy Framework
The actionable framework here centers on three distinct positioning considerations.
First, the breadth trade is more important than the index trade. Several firms in the S&P 500, many from non-tech industries, have posted margin gains linked to AI, pushing the typical lift to 1.5 percentage points. The companies where that margin lift is new, and not yet reflected in consensus estimates, are where risk-adjusted returns are more favorable than chasing the mega-cap names that have already repriced. Industrials, logistics, and select financial services names are the sectors worth screening for agent-driven margin inflection.
Second, enterprise software ARR is the leading indicator to watch. The median payback period on AI agent deployments is 5.1 months across functions, with SDR agents paying back in 3.4 months and finance and operations agents in 8.9 months. Companies reporting deployments in Q1 2026 are entering their payback window now. When those deployments hit breakeven, enterprise buyers expand. Watch for any acceleration in net revenue retention rates at enterprise software names in Q3 results. That is the data point that validates the bull case mechanically.
Third, volatility is likely to spike in August and September even if the index holds. The seasonal pattern is real, the macro calendar is dense with Fed meetings and CPI readings, and geopolitical risk has not disappeared. Rather than avoiding the sector, disciplined traders can use elevated implied volatility to structure positions that benefit from the AI productivity story without taking on unhedged directional risk in a seasonally weak window. Define maximum loss before entry on any new positions established near record highs.
Key levels: 7,620 is the line in the sand on the downside. A close below 7,550 changes the near-term framework. On the upside, 7,900 is the first zone where sellers are likely to re-emerge as the market approaches Goldman’s year-end target ahead of schedule. Position sizing should reflect the asymmetry between a confirmed breakout and a historically weak seasonal period arriving simultaneously.
Professional Conclusion
The AI agent productivity story has crossed the threshold from projection to measurement. 2026 marks the definitive transition from experimental pilots to production-grade, revenue-linked deployments of enterprise AI agents. The margin expansion showing up in Q2 results across logistics, financial services, and enterprise software is not a coincidence or an accounting artifact. It is the early return on three years of infrastructure investment, and it is broadening.
What matters for the next three months is not whether the story is real. It is how much of it is already in the price, and whether the incremental data points, Q3 guidance, Fed decisions, and enterprise software ARR updates, confirm or disrupt the earnings trajectory that Goldman has converged on at 8,000.
Preparation here means mapping the specific trigger points: the September Fed decision, the Q3 earnings season starting in mid-October, and the monthly CPI readings that sit between here and year-end. Traders who know exactly what they are watching for and have defined their response in advance will navigate the seasonal noise far better than those reacting to headlines. The AI productivity dividend is real. The discipline required to capture it is the same as it has always been.
For informational and educational purposes only. Not investment advice. Trading involves risk, including loss of principal.